Anatomy of a logger
Poking at the Zap logging library for Go and discovering how seemingly simple things can be kind of complicated
- 24 minsZap is a structured logging library from Uber that is built on top of a “reflection-free, zero-allocation JSON encoder” to achieve some very impressions performance comapred to other popular logging libraries for Go. As part of developing integrations for it at Sourcegraph, I thought I’d take the time to look at what goes on under the hood.
Logging seems like a simple thing that should be tangential to your application’s concerns - how complicated could writing some output be? Why bother making logging faster at all? The first item in Zap’s FAQ provides a brief explanation:
Of course, most applications won’t notice the impact of a slow logger: they already take tens or hundreds of milliseconds for each operation, so an extra millisecond doesn’t matter.
On the other hand, why not make structured logging fast? […] Across a fleet of Go microservices, making each application even slightly more efficient adds up quickly.
In my personal experience, I’ve seen logging cause some very real issues - a debug statement I left in a Sourcegraph service once caused a customer instance to stall completely!
Metrics indicated jobs were timing out, and a look at the logs revealed thousands upon thousands of lines of random comma-delimited numbers. It seemed that printing all this junk was causing the service to stall, and sure enough setting the log driver to none to disable all output on the relevant service allowed the sync to proceed and continue. […] At scale these entries could contain many thousands of entries, causing the system to degrade. Be careful what you log!
At Sourcegraph we currently use the cheekily named log15 logging library. Of course, a faster logger likely would not have prevented the above scenario from occurring (though we are in the process of migrating to our new Zap-based logger), but here’s a set of (very unscientific) profiles that compare a somewhat “average” scenario of logging 3 fields with 3 fields of existing context in JSON format to demonstrate just how different Zap and log15 handles rendering a log entry behind the scenes:
const iters = 100000

var (
	thing1 = &thing{Field: "field1", Date: time.Now()}
	thing2 = &thing{Field: "field2", Date: time.Now()}
)

func profileZap(f *os.File) {
	// Create JSON format l with fields, normalised against log15 features
	cfg := zap.NewProductionConfig()
	cfg.Sampling = nil
	cfg.DisableCaller = true
	cfg.DisableStacktrace = true
	l, _ := zap.NewProduction()
	l = l.With(
		zap.String("1", "foobar"),
		zap.Int("2", 123),
		zap.Any("3", thing1),
	)

	// Start profile and log a lot
	pprof.StartCPUProfile(f)
	for i := 0; i < iters; i += 1 {
		l.Info("message",
			zap.String("4", "foobar"),
			zap.Int("5", 123),
			zap.Any("6", thing2),
		)
	}
	l.Sync()
	pprof.StopCPUProfile()
}

func profileLog15(f *os.File) {
	// Create JSON format l with fields
	l := log15.New(
		"1", "foobar",
		"2", 123,
		"3", thing1,
	)
	l.SetHandler(log15.StreamHandler(os.Stdout, log15.JsonFormat()))

	// Start profile and log a lot
	pprof.StartCPUProfile(f)
	for i := 0; i < iters; i += 1 {
		l.Info("message",
			"4", "foobar",
			"5", 123,
			"6", thing2,
		)
	}
	pprof.StopCPUProfile()
}
The resulting call graphs, generated using go tool pprof -prune_from=^os -png, with log15 on the left and Zap on the right:
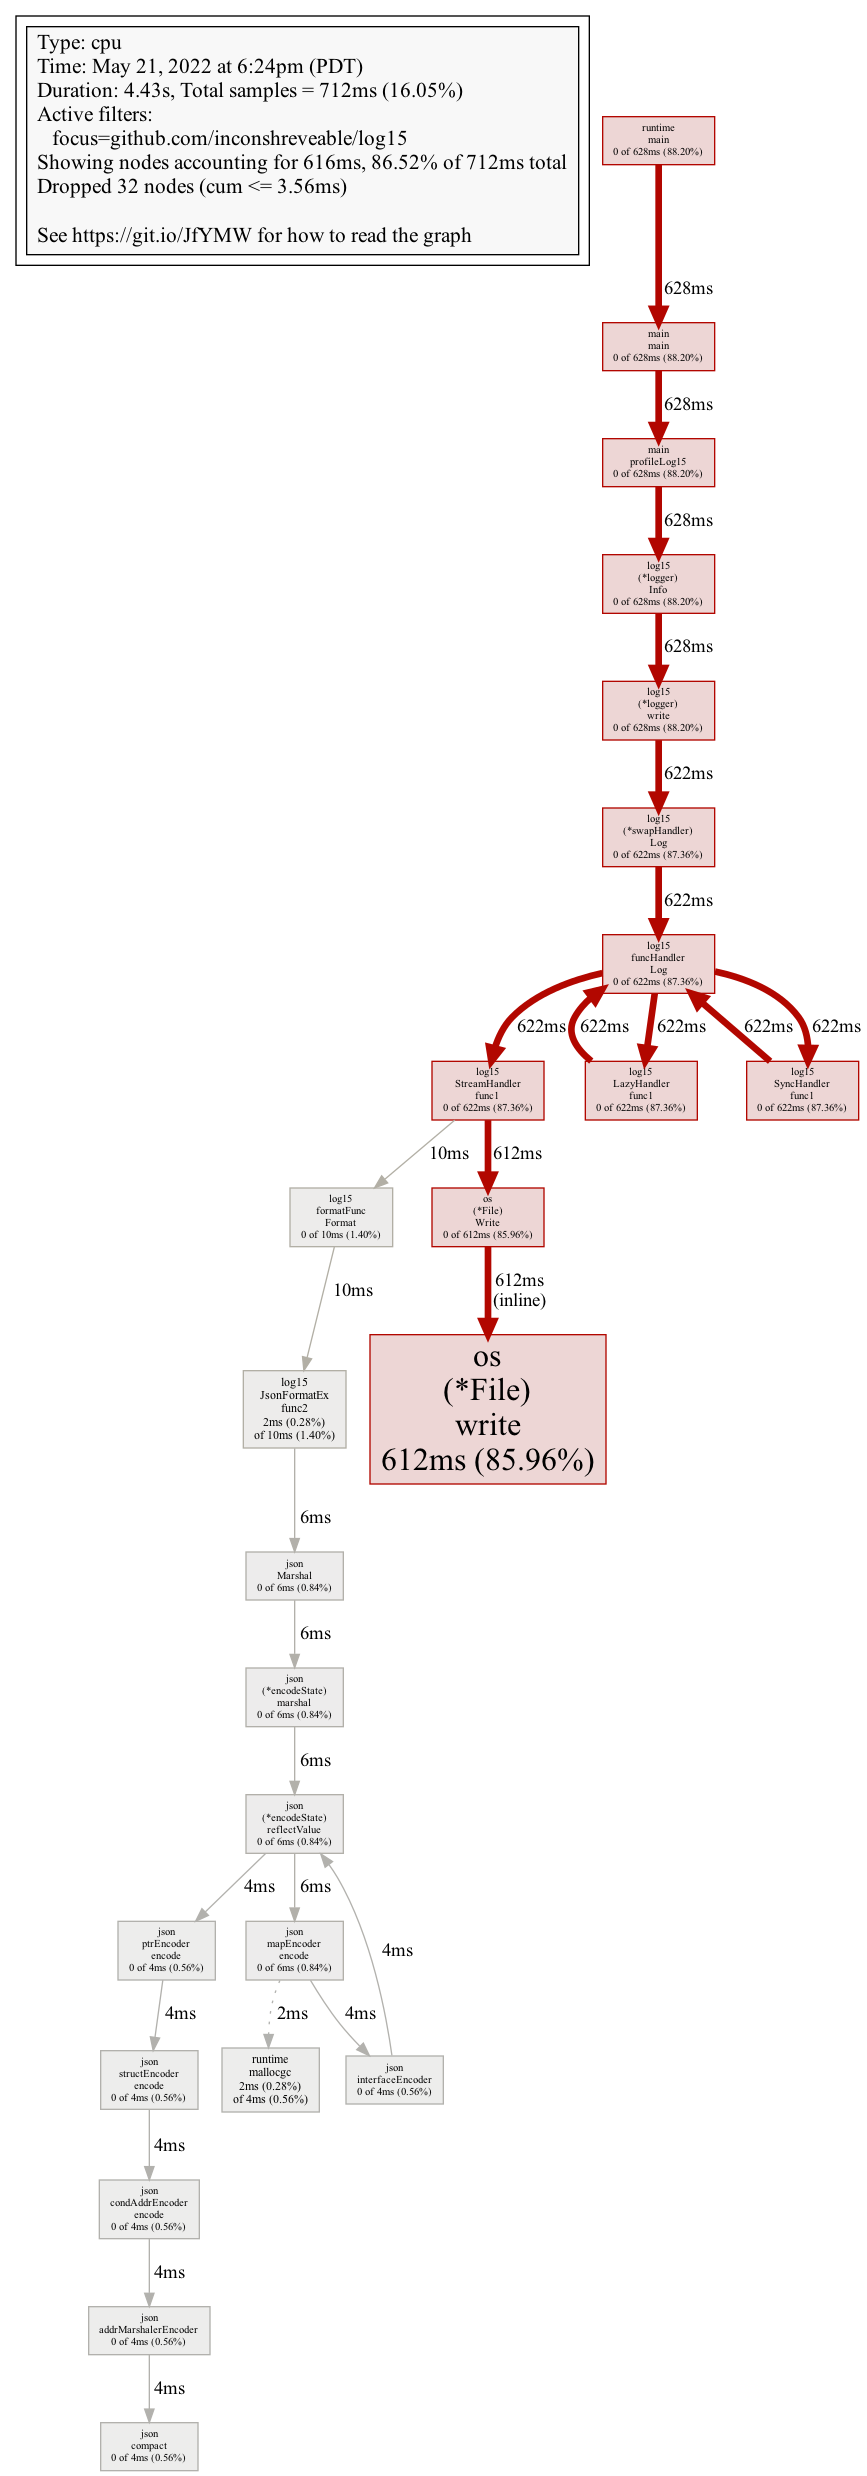
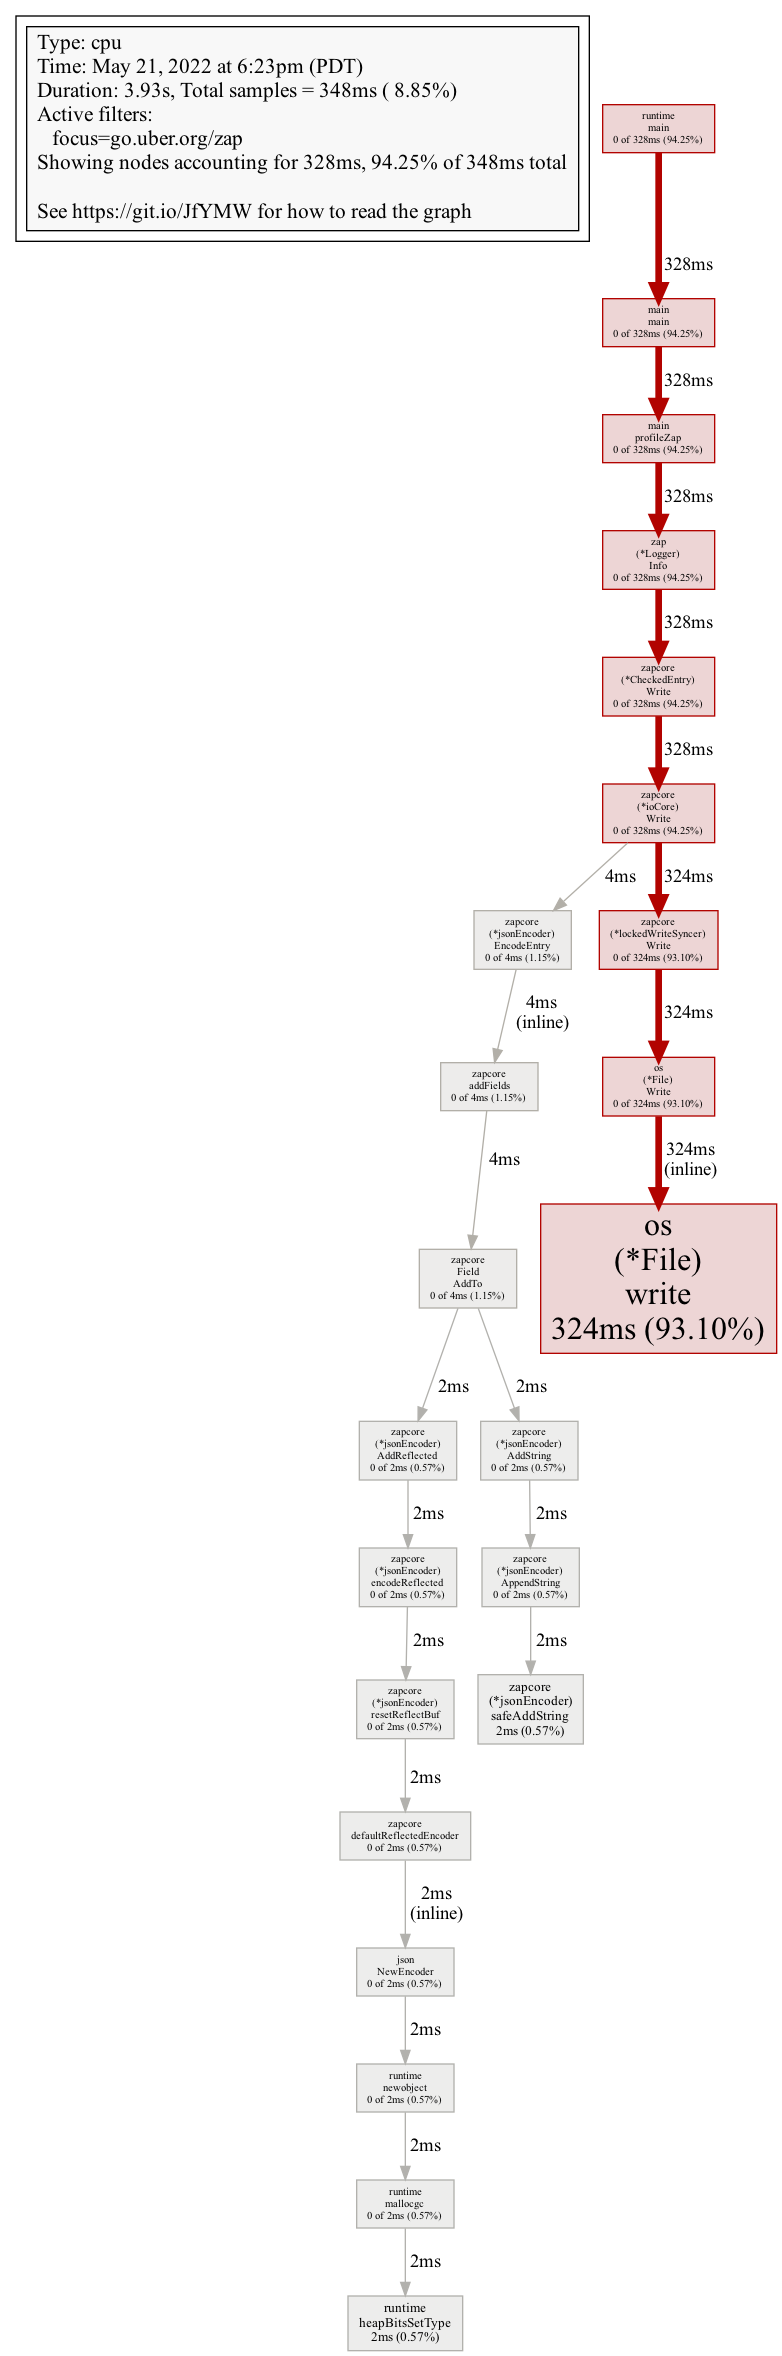
os code where work begins to write data to disk - log15 is on the left, and zap is on the right. You might have to zoom in a bit. Check out the pprof documentation for intepreting the callgraph to learn more.
It is not immediately evident how the Zap logger is supposed to be better than the log15 logger, since both finish running pretty quickly, have similar-looking call graphs, and ultimately have I/O as the major bottleneck (the big red os.(*.File).write blocks). However, a closer look (like, really close - you gotta zoom all the way in!) reveals a key hint - both loggers spend enough time in JSON encoding stages for the profiler to pick up, but the details of their JSON encoding differs somewhat:
-
log15quickly delegates what appears to be the entire log entry tojson.Marshal, which accounts for ~6ms. - Zap delegates fields to several different handlers: we see an
AddStringandAddReflected, where only the latter ends up in thejsonlibrary, where it only accounts for ~2ms. Presumably, it is handling certain fields differently than others, where in some cases it skips encoding with thejsonlibrary entirely!
Zap’s documentation provides a brief explanation of why delegating to json is an issue:
For applications that log in the hot path, reflection-based serialisation and string formatting are prohibitively expensive — they’re CPU-intensive and make many small allocations. Put differently, using
encoding/jsonandfmt.Fprintfto log tons ofinterface{}s makes your application slow.
As a more scientific approach to demonstrating the benefits of Zap’s implementation, here’s a snapshot of the advertised benchmarks against some other popular libraries (as of v1.21.0), emphasis mine:
Log a message and 10 fields:
Package Time Time % to zap Objects Allocated zap
2900 ns/op +0% 5 allocs/op 3475 ns/op +20% 10 allocs/op zerolog 10639 ns/op +267% 32 allocs/op go-kit 14434 ns/op +398% 59 allocs/op logrus 17104 ns/op +490% 81 allocs/op apex/log 32424 ns/op +1018% 66 allocs/op log15 33579 ns/op +1058% 76 allocs/op Log a message with a logger that already has 10 fields of context:
Package Time Time % to zap Objects Allocated 373 ns/op +0% 0 allocs/op 452 ns/op +21% 1 allocs/op zerolog 288 ns/op -23% 0 allocs/op go-kit 11785 ns/op +3060% 58 allocs/op logrus 19629 ns/op +5162% 70 allocs/op log15 21866 ns/op +5762% 72 allocs/op apex/log 30890 ns/op +8182% 55 allocs/op
In these scenarios, log15 can be a whopping 10 to 50 times slower - very cool! Evidently Zap’s approach has impressive results, and we know roughly what it doesn’t do to achieve this performance - but how does it work in practice?
# A writer for log entries
The README suggests the following as the preferred way to create and start using a Zap logger, which is very similar to what I do when I attempted to profile logging calls earlier:
logger, _ := zap.NewProduction()
defer logger.Sync()
Internally, this takes a default, high-level configuration and builds a logger from it using the following components:
- a
zapcore.Core, which is constructed from:- a
zapcore.Encoder - a
zapcore.WriteSyncer(also referred to as a “sink”)
- a
- a bunch of
Options
For brevity, let’s forget about the Options for now and focus on the first component: zapcore.Core, which is described as the real logging interface beneath Zap, which exports the more traditional logging methods like .Info(), .Warn(), and so on - the equivalent of an io.Writer for structured logging instead of generic output.
zapcore.Core splits the logging of a message, such as .Info("message", fields...), into the following distinct steps:
-
Check:
Check(Entry, *CheckedEntry) *CheckedEntrythat determines if the message should be logged at all. This is where the traditional level filtering comes in (i.e. when you want to only log messages above a certain level, like discarding.Debug()messages), or discarding repeated messages through sampling.- In this interface, we get a read-only
Entryand a mutable*CheckedEntrythat a core registers itself onto if it decides the givenEntryshould be logged.
- In this interface, we get a read-only
-
Write:
Write(Entry, []Field) error, where the rendering of a log entry into the destination occurs.
In addition, we have distinct steps for:
-
Adding fields to the logger (as opposed to just a specific entry):
With([]Field) Core- this allowsCoreimplementations render fields once and not repeat work for subsequent log entries. We’ll get to how this works later!- It’s not noted on the interface documentation, but because of the above, the fields provided to
With()are not provided toWrite().
- It’s not noted on the interface documentation, but because of the above, the fields provided to
-
Flushing output:
Sync() errorallows for buffering output and batching writes together, minimising instances of being bottlenecked by I/O, or allowingCoreimplementations to handle logs in an asynchronous manner.
We can see this in action in the default *zap.Logger implementation. Let’s check out the seemingly innocuous .Info() function:
func (log *Logger) Info(msg string, fields ...Field) {
	if ce := log.check(InfoLevel, msg); ce != nil {
		ce.Write(fields...)
	}
}
# Check
First up we have log.check, a whopping 102-line function that implements the check step of writing a log entry, which constructs an zapcore.Entry and calls the core.Check function:
func (log *Logger) check(lvl zapcore.Level, msg string) *zapcore.CheckedEntry {
	// ... omitted for brevity

	// Create basic checked entry thru the core; this will be non-nil if the
	// log message will actually be written somewhere.
	ent := zapcore.Entry{
		LoggerName: log.name,
		Time:       log.clock.Now(),
		Level:      lvl,
		Message:    msg,
	}
	ce := log.core.Check(ent, nil)

	// ...

	return ce
}
Note that log.core.Check(ent, nil) is pretty elaborate here - we noted previously that in this function, Core implementations should register themselves on the second argument CheckedEntry. How does that work if the CheckedEntry argument is a nil pointer? Taking a look at CheckedEntry.Write(), we can see the first hints of some pretty aggressive optimization:
// AddCore adds a Core that has agreed to log this CheckedEntry. It's intended to be
// used by Core.Check implementations, and is safe to call on nil CheckedEntry
// references.
func (ce *CheckedEntry) AddCore(ent Entry, core Core) *CheckedEntry {
	if ce == nil {
		ce = getCheckedEntry()
		ce.Entry = ent
	}
	ce.cores = append(ce.cores, core)
	return ce
}

var _cePool = sync.Pool{New: func() interface{} {
	// Pre-allocate some space for cores.
	return &CheckedEntry{
		cores: make([]Core, 4),
	}
}}

func getCheckedEntry() *CheckedEntry {
	ce := _cePool.Get().(*CheckedEntry)
	ce.reset()
	return ce
}
In short, CheckedEntry instances are created or reused on demand (this way, if no cores register themselves to write an Entry, no CheckedEntry is ever created) from a global sync.Pool:
A Pool is a set of temporary objects that may be individually saved and retrieved […] Pool’s purpose is to cache allocated but unused items for later reuse, relieving pressure on the garbage collector. […] Pool provides a way to amortise allocation overhead across many clients.
If many logs entries are written in a short time, allocated memory can be recycled by Pool, which is faster than having the Go runtime always allocate new memory and garbage-collecting unused CheckedEntry instances.
# Write
Then we move on to the write step, done in ce.Write. This is the *zapcore.CheckedEntry we mentioned before performing a write on all registered cores:
func (ce *CheckedEntry) Write(fields ...Field) {
	if ce == nil {
		return
	}

	// ... omitted for brevity

	var err error
	for i := range ce.cores {
		err = multierr.Append(err, ce.cores[i].Write(ce.Entry, fields))
	}

	// ...

	putCheckedEntry(ce)

	// ...
}

func putCheckedEntry(ce *CheckedEntry) {
	if ce == nil {
		return
	}
	_cePool.Put(ce)
}
Note the call to putCheckedEntry - after the entry has been written, it is no longer needed, and this call places the entry into the entry for reuse. Nifty!
Sent into Write is still an Entry and Fields, however - we’ve yet to see how our message ends up as text, which is where the performance gains are supposed to be.
# Encoding and writing output
Looking back, we have two components that are used to create a Core earlier on: zapcore.Encoder and zapcore.WriteSyncer.
	log := New(
		zapcore.NewCore(enc, sink, cfg.Level),
		cfg.buildOptions(errSink)...,
	)
Encoder exports a function, EncodeEntry, that seems to mirror the signature of Core.Write, and also embeds the ObjectEncoder interface:
// Encoder is a format-agnostic interface for all log entry marshalers. Since
// log encoders don't need to support the same wide range of use cases as
// general-purpose marshalers, it's possible to make them faster and
// lower-allocation.
type Encoder interface {
	ObjectEncoder

	// EncodeEntry encodes an entry and fields, along with any accumulated
	// context, into a byte buffer and returns it. Any fields that are empty,
	// including fields on the `Entry` type, should be omitted.
	EncodeEntry(Entry, []Field) (*buffer.Buffer, error)

	// ...
}
In ObjectEncoder we see the promise of a “reflection-free, zero-allocation JSON encoder” in the form of a giant interface, shortened for brevity:
// ObjectEncoder is a strongly-typed, encoding-agnostic interface for adding a
// map- or struct-like object to the logging context. Like maps, ObjectEncoders
// aren't safe for concurrent use (though typical use shouldn't require locks).
type ObjectEncoder interface {
	// Logging-specific marshalers.
	AddObject(key string, marshaler ObjectMarshaler) error

	// Built-in types.
	AddBool(key string, value bool)
	AddDuration(key string, value time.Duration)
	AddInt(key string, value int)
	AddString(key, value string)
	AddTime(key string, value time.Time)

	// AddReflected uses reflection to serialise arbitrary objects, so it can be
	// slow and allocation-heavy.
	AddReflected(key string, value interface{}) error

	// ...
}
This seemingly crazy interface allows messages to be incrementally built in the desired format without ever hitting json.Marshal. For example, we can look at what the JSON encoder does to add a string field:
func (enc *jsonEncoder) AddString(key, val string) {
	enc.addKey(key)
	enc.AppendString(val)
}
We start with adding the key, then the value:
func (enc *jsonEncoder) addKey(key string) {
	enc.addElementSeparator()
	enc.buf.AppendByte('"')
	enc.safeAddString(key)
	enc.buf.AppendByte('"')
	enc.buf.AppendByte(':')
}
Reading this carefully, given a key you’ll end up with the following being added to enc.buf (a bytes buffer):
"key":
^ ^ ^^
| | ||
| | |└ AppendByte(':')
| | └ AppendByte('"')
| └ safeAddString(key)
└ AppendByte('"')
Presumably what comes next is a value, for example a string:
func (enc *jsonEncoder) AppendString(val string) {
	enc.addElementSeparator()
	enc.buf.AppendByte('"')
	enc.safeAddString(val)
	enc.buf.AppendByte('"')
}
"key":"val"
      ^ ^ ^
      | | |
      | | |
      | | └ AppendByte('"')
      | └ safeAddString(val)
      └ AppendByte('"')
Encoding the entire entry in EncodeEntry works similarly, with your typical JSON opening and closing braces being written first:
final.buf.AppendByte('{')

// ... render log entry

final.buf.AppendByte('}')
final.buf.AppendString(final.LineEnding)
{"key":"val"}\n
^           ^ ^
|           | └ AppendString(final.LineEnding)
|           └ AppendByte('}')
└ AppendByte('{')
Stepping back up a bit, we can now better understand how zapcore.Field works, again condensed for brevity:
type Field struct {
	Key       string
	Type      FieldType
	Integer   int64
	String    string
	Interface interface{}
}

func (f Field) AddTo(enc ObjectEncoder) {
	var err error
	switch f.Type {
	case ObjectMarshalerType:
		err = enc.AddObject(f.Key, f.Interface.(ObjectMarshaler))
	case BoolType:
		enc.AddBool(f.Key, f.Integer == 1)
	case DurationType:
		enc.AddDuration(f.Key, time.Duration(f.Integer))
	case StringType:
		enc.AddString(f.Key, f.String)
	case ReflectType:
		err = enc.AddReflected(f.Key, f.Interface)

	// ...
	}

	// ...
}
Here we can see that for most cases, when one creates a strongly typed field with e.g. zap.String(key string, val string) Field, Zap can track the type information and pass the Field directly to the most appropriate function on the underlying encoder. Together with the fact that the entire log message is constructed incrementally, this means that it’s possible for most log messages to never encounter the need to reflect or use the json package to serialise the message. Nifty! This explains why we spend less time in json in the profile at the start of this post - most of the log message can be serialised directly, except for one field:
l.Info("message",
	zap.String("4", "foobar"),
	zap.Int("5", 123),
	zap.Any("6", thing2), // this goes to AddReflected, which uses JSON to marshal the field
)
To get around this, we could implement ObjectMarshaler which we saw on the Encoder interface previously. If implemented, we can serialise our object directly in an efficient manner:
type thing struct {
	Field string
	Date  time.Time
}

func (t *thing) MarshalLogObject(enc zapcore.ObjectEncoder) error {
	enc.AddString("Field", t.Field)
	enc.AddTime("Date", t.Date)
	return nil
}
We can re-run the profiling script from the start of the post to see that there’s no more usage of json!
Going back a bit, we can see that this also simplifies the encoding of fields that are added to the logger itself in the Core.WithFields we saw earlier by looking at the ioCore.With implementation, which immediately encodes the given fields:
func (c *ioCore) With(fields []Field) Core {
	clone := c.clone()
	for i := range fields {
		fields[i].AddTo(enc)
	}
	return clone
}
EncodeEntry checks if there are fields already encoded, and adds the partial JSON into the message directly - no additional work needed.
# tl;dr
Turns out, seemingly simple things can be kind of complicated! However, in this case the result is a neat exhibit of a variety of optimization techniques and a logging implementation that can outpace other libraries by an order of magnitude.
Zap’s design also provides some interesting ways to hook into its behaviour - Zap itself offers some examples, such as zaptest, which creates a logger with a custom Writer that sends output to Go’s standard testing library.
At Sourcegraph, our new Zap-based logger offers utilities to hook into an our configured logger using Zap’s WrapCore API to assert against log output (mostly for testing the log library itself), partly built on the existing zaptest utilities. We’re also working on custom Core implementations to automatically send logged errors to Sentry, and we wrap Field constructors to define custom behaviours (we disallow importing directly from Zap for this reason). Pretty nifty to still have such a high degree of customizability in an implementation so focused on optimizations!